
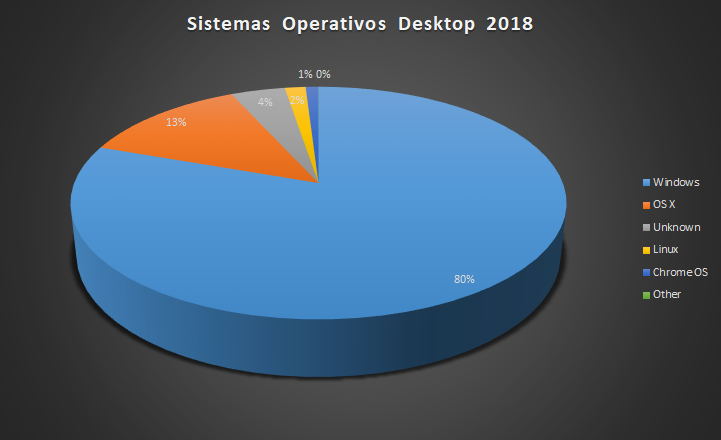
Most used PC operating systems in 2018
| Operating system | Percent |
| Windows | 80,39 % |
| OSX | 12,85 % |
| Desconocido | 4,17 % |
| Linux | 1,60% |
| Chrome OS | 0,97 % |
| Otros | 0,01 % |
Los sistemas operativos para PC de Microsoft Windows, siguieron siendo los más usados en 2018 en el mundo con un 80%, muy de lejos le siguieron los sistemas operativos de Apple con casi un 13% de participación en el mercado:
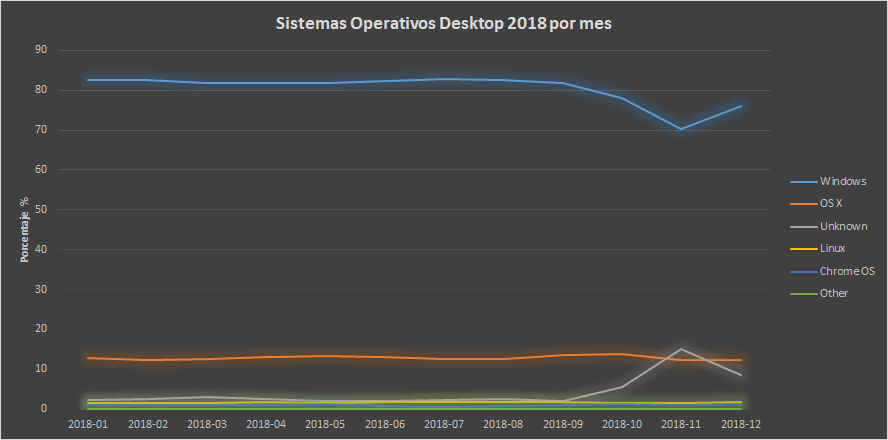
The following chart shows their distribution by months of 2018, of the most used PC operating systems:
Most used mobile operating systems 2018
| Sistema Operativo | Porcentaje |
| Android | 72,12 % |
| iOS | 23,98 % |
| Desconocido | 1,70 % |
| Windows | 0,44 % |
| Series 40 | 0,26% |
| KaiOS | 0,3 % |
| Samsung | 0,26 % |
| Nokia Desconocido | 0,18 % |
| Playstation | 0,14 % |
| Tizen | 0,13 % |
| Symbian OS | 0,09 % |
| Blackberry OS | 0,09 % |
| Firefox OS | 0,08 % |
| Linux | 0,06 % |
| Xbox | 0,02 % |
| LG | 0,14 % |
| Sony Ericsson | 0,01 % |
| Other | 0,02 % |
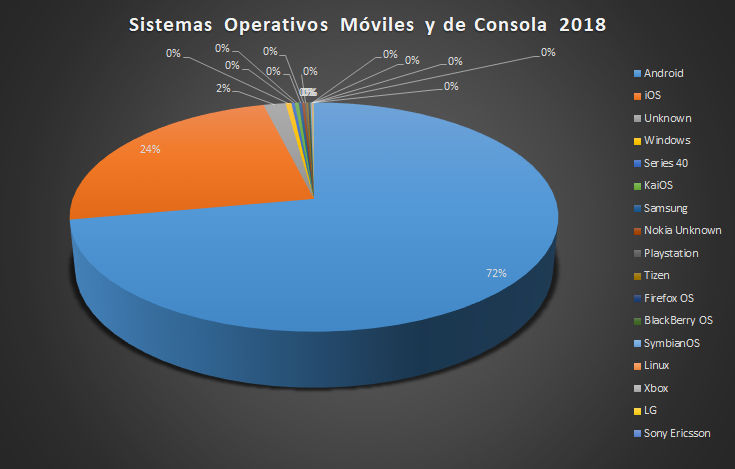
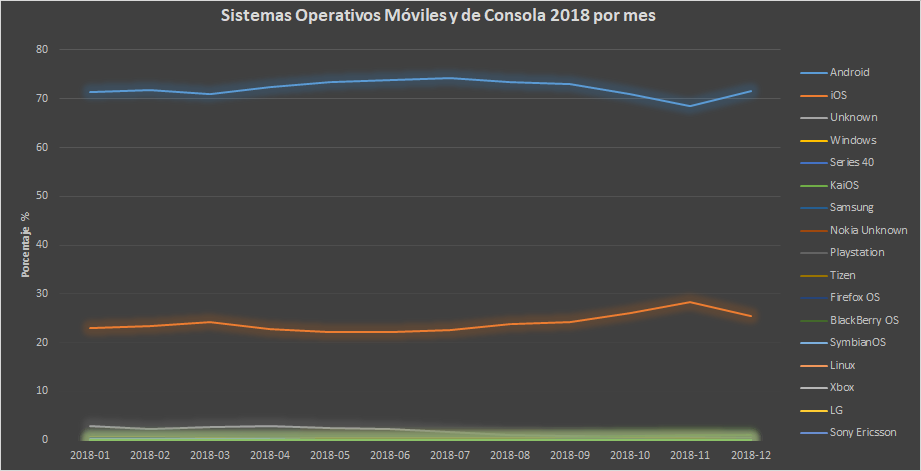
In terms of mobile operating systems, the most widely used in 2018 were Android and iOS systems, although the former has a wide global lead with 72%, compared to 23% for iOS.
The following chart shows the 2018 distribution by month of the most used mobile operating systems:
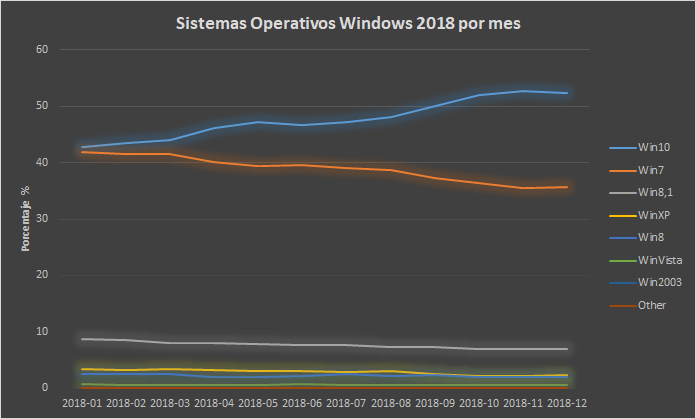
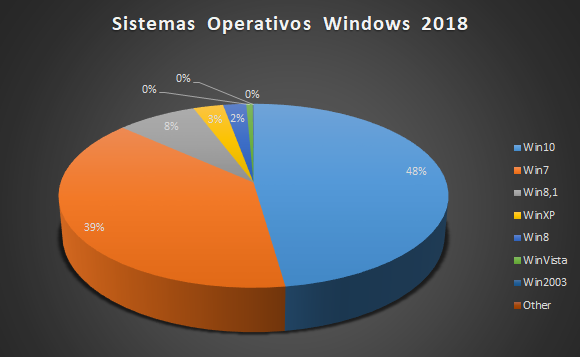
Most used Windows operating systems 2018
| Operating system | Percent |
| Win10 | 47,73 % |
| Win7 | 38,87 % |
| Win8.1 | 7,64 % |
| WinXP | 2,85 % |
| Win8 | 2,20 % |
| WinVista | 0,61 % |
| Win2003 | 0,05 % |
| Otros | 0,01 % |
In 2018, Windows 10 gained the largest market share at 47%, while Windows 7 has been losing relevance as it has been discontinued thanks to Microsoft dropping support for it.
The following graph shows the distribution by month in 2018, of the use of Windows operating systems: