
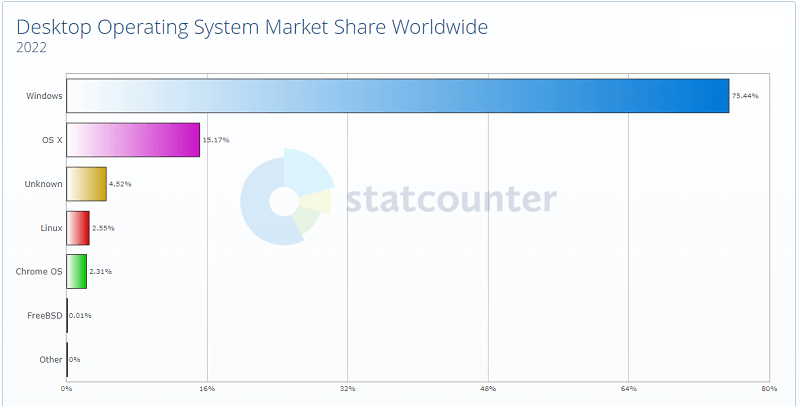
Most used desktop operating systems in 2022
| Operating System | Percent |
|---|---|
| Windows | 75,44 % |
| OS X | 15,17 % |
| Desconocido | 4,52 % |
| Linux | 2,55 % |
| Chrome OS | 2,31 % |
| FreeBSD | 0,01 % |
| Otros | 0 % |
In 2022, the most used operating system was Windows, with a market share of 75.44%, followed by OSX with 15.17%. This means that Windows had a slight rebound, compared to the year 2021 (74.76%).
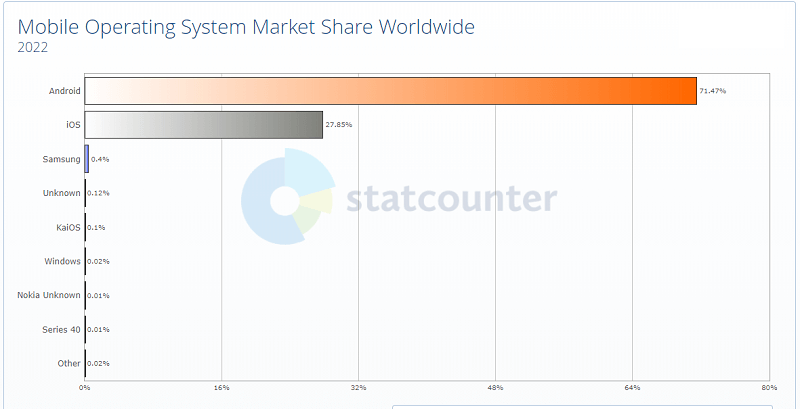
Most used mobile operating systems in 2022
| Operating system | Percent |
|---|---|
| Android | 71,74 % |
| iOS | 27,63 % |
| Samsung | 0,35 % |
| Desconocido | 0,12 % |
| KaiOS | 0,11% |
| Windows | 0,02 % |
Android had the largest share of the mobile operating system market, with 71.14%, followed by iOS with 27.63%, with Samsung in third place with 0.35%. Relative to 2021 (70.52%), Android had a slightly higher share in 2022.
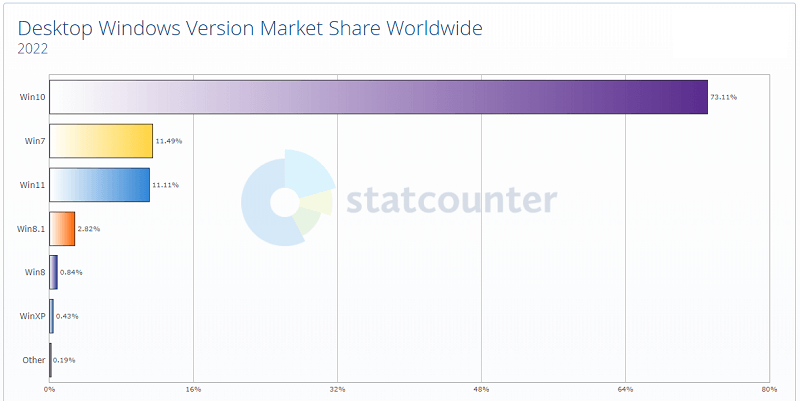
Most used Windows Operating Systems 2022
| Operating System | Percent |
|---|---|
| Win10 | 68,75 % |
| Win11 | 18,13 % |
| Win7 | 9,62 % |
| Win8.1 | 2,31 % |
| Win8 | 0,62 % |
| WinXP | 0,45 % |
In 2022, Windows 10 had the highest global share with 68.75%, followed by Windows 11 with 18.13 %, leaving Windows 7 in third place with 9.62%. In relation to the year 2021, Win10 lost share (79.36 %) with the appearance of Win11. Similarly, Win7 had a share in 2021 of 15.42%, dropping to 9.62% in 2022.
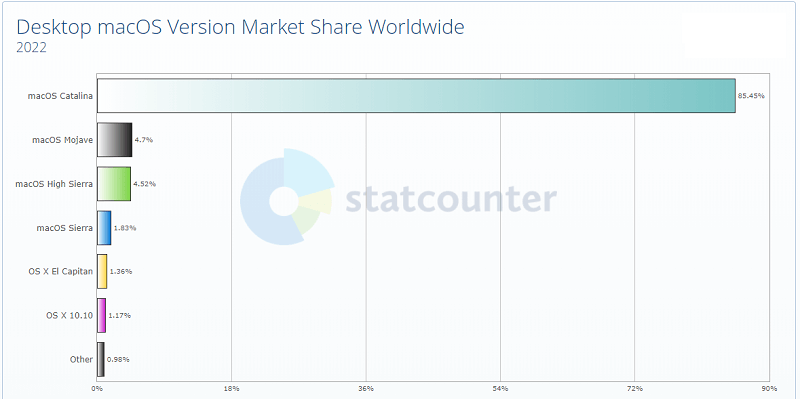
Regarding the most used MacOS operating systems in 2022, the one with the highest market share is MacOS Catalina with 87.37%, followed by MacOS High Sierra with 3.95%.
Most used MacOS operating systems in 2022
| Operating system | Percent |
|---|---|
| MacOS Catalina | 87,37 % |
| MacOS High Sierra | 3,95 % |
| MacOS Mojave | 3,9 % |
| MacOS Sierra | 1,46 % |
| OS X 10.10 | 1,13 % |
| OS X El Capitan | 1,04 % |
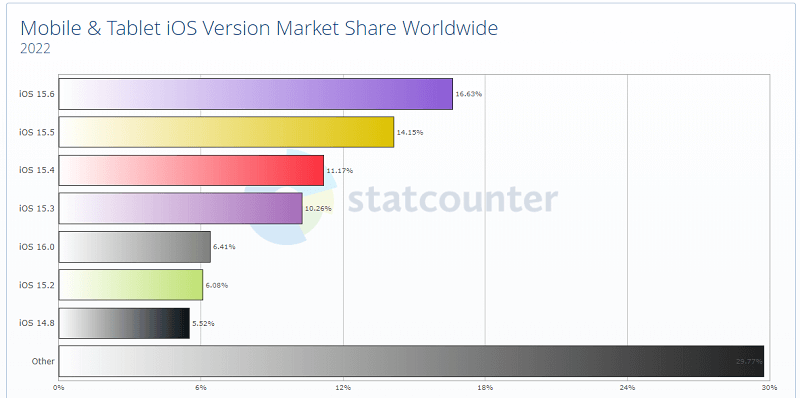
Most used iOS operating systems in 2022
| Operating System | Percent |
|---|---|
| iOS 16.1 | 31,19 % |
| iOS 15.5 | 19,91 % |
| iOS 15.6 | 12,08 % |
| iOS 16.0 | 11,38 % |
| iOS 15.7 | 6,05 % |
| iOS 15.5 | 3% |
The most used iOS version in 2022 was 16.1, with a share of 31.19%, followed by 15.5 with a share of 19.91%.
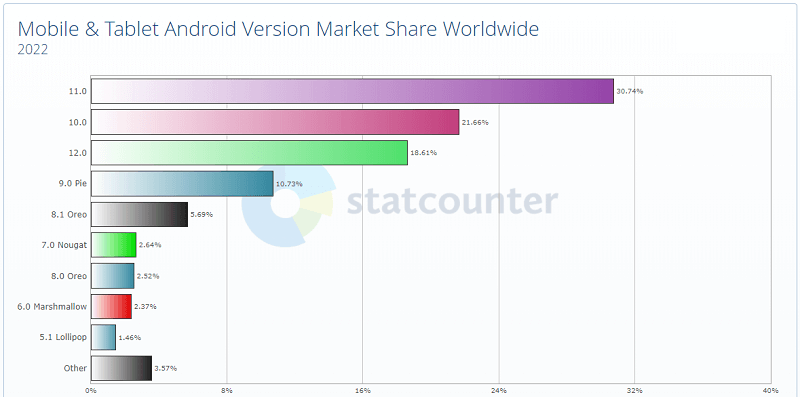
Most used Android operating systems in 2022
| Operating System | Percent |
|---|---|
| 12.0 | 25,12 % |
| 11.0 | 23,03 % |
| 10.0 | 17,76 % |
| 13.0 | 11.8 % |
| 9.0 Pie | 8,61 % |
| 8.1 Oreo | 4,9 % |
In 2022 the most used Android version was Android 12.0 with 25.12%, followed by Android 11.0 with a share of 23.03%.