In this article we are going to show which were the most used operating systems in 2023, according to StatCounter GlobalStats.
Considering PC systems, as well as mobile operating systems, and in particular the Windows, MacOS and Android operating system types.
Most used desktop operating systems in 2023
| Operating system | Percentage (%) |
|---|---|
| Windows | 69 |
| OS X | 19 |
| Unknown | 6 |
| Chrome OS | 3 |
| Linux | 3 |
| Other | 0 |
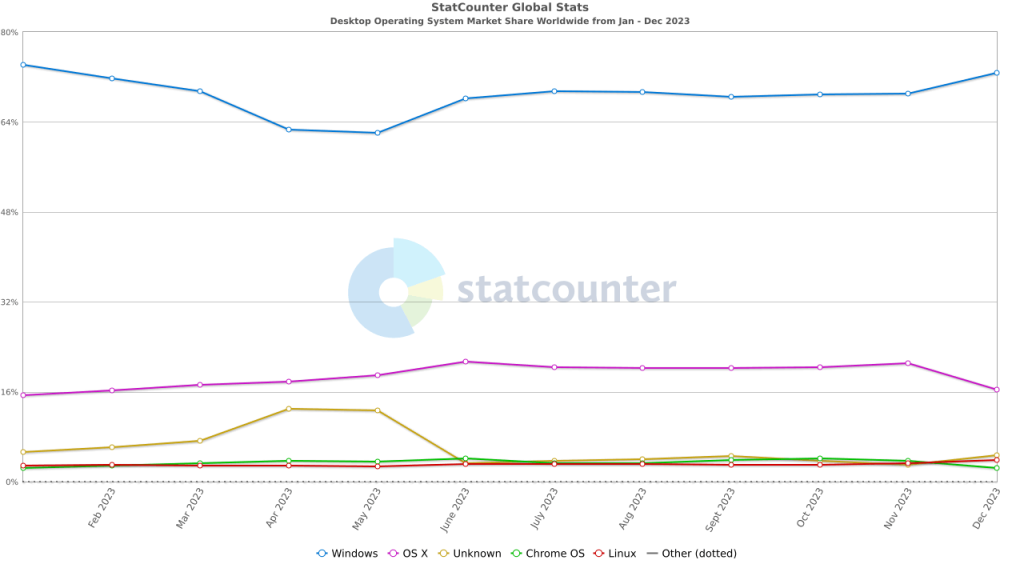
In 2023, the most used desktop operating system was Windows, with 69%, followed by OS X with 19%. Although the hegemony of Windows is still notorious, compared to the same period in 2022, Windows lost market share (75% to 69%), while OS X increased part of its share (15% to 19%).
Most used Mobile Operating Systems in 2023
| Operating system | Percentage (%) |
|---|---|
| Android | 69,12 |
| iOS | 29,65 |
| Xbox | 0,51 |
| Samsung | 0,36 |
| Unknown | 0,14 |
| KaiOS | 0,13 |
| Playstation | 0,03 |
| Windows | 0,02 |
| Linux | 0,02 |
| Other | 0,03 |
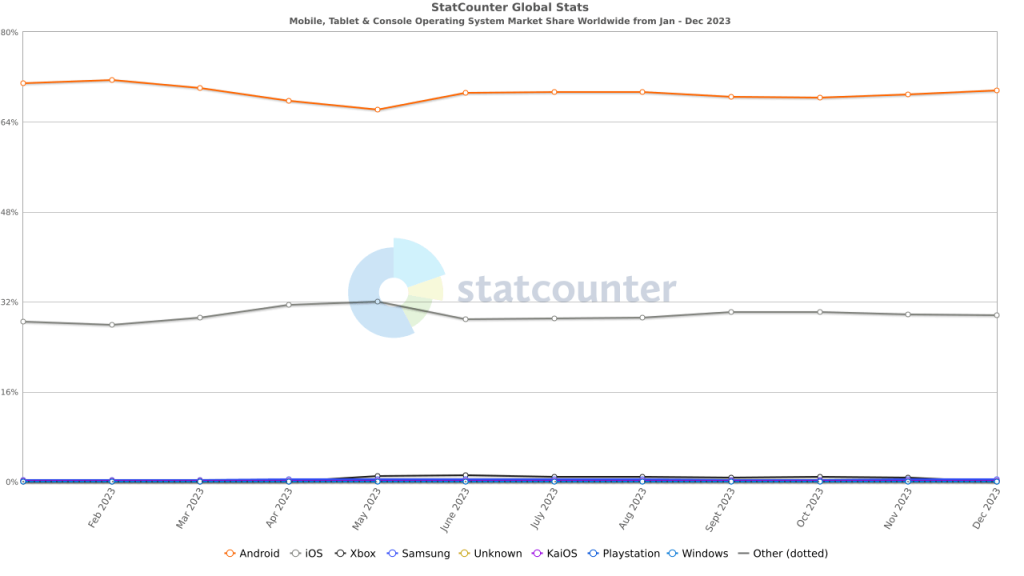
In 2023, the most used mobile operating system was Android, with 69%, while iOS was a close second with 29%. Although the difference is still quite large between Android and iOS, in 2023, there was a small reduction in Android’s share (-2%) compared to 2022, while iOS had a small increase (+2%).
Most used Windows Operating Systems 2023
| Operating system | Percentage (%) |
|---|---|
| Win10 | 70,79 |
| Win11 | 23,17 |
| Win7 | 4,12 |
| Win8.1 | 1,02 |
| Win8 | 0,39 |
| WinXP | 0,4 |
| WinVista | 0,09 |
| Win2003 | 0,02 |
| Other | 0,01 |
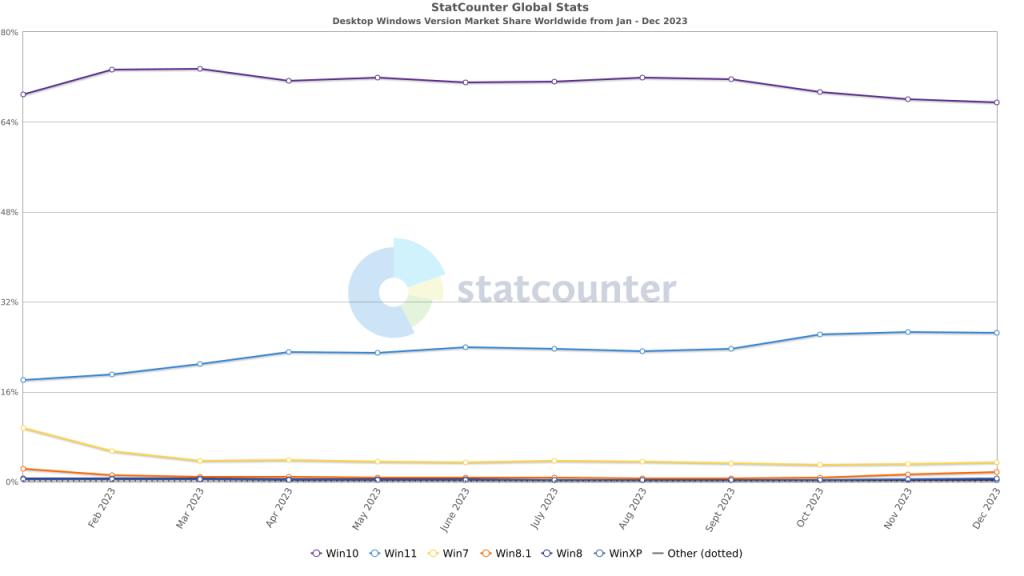
In this year, the largest market share is still held by Windows 10 with 70.79%, while Windows 11 is quite far behind with 23%. In 2022, Win10 had a 68% share, and Win 11 had 28%, which indicates that in practically one year, there has not been a strong adoption of Win 11 over Win 10.
Most used MacOS operating systems in 2023
| Operating system | Percentage (%) |
|---|---|
| macOS Catalina | 91,8 |
| macOS High Sierra | 1,93 |
| macOS Mojave | 1,87 |
| macOS Sierra | 1,18 |
| OS X 10.10 | 1,02 |
| OS X El Capitan | 0,97 |
| OS X Mavericks | 0,32 |
| mac OS X Snow Leopard | 0,13 |
| macOS Big Sur 11.0 | 0,13 |
| macOS Big Sur 10.16 | 0,09 |
| macOS Big Sur 11.2 | 0,08 |
| mac OS X Lion | 0,07 |
| OS X Mountain Lion | 0,07 |
| mac OS X Leopard | 0,07 |
| mac OS X Tiger | 0,05 |
| mac OS X Panther | 0,04 |
| mac OS X Jaguar | 0,04 |
| macOS Big Sur 11.3 | 0,04 |
| macOS Big Sur 11.1 | 0,03 |
| macOS Big Sur 11.5 | 0,02 |
| macOS 11.6 | 0,02 |
| macOS Big Sur 11.4 | 0,02 |
| macOS 11.7 | 0,01 |
| Other | 0,04 |
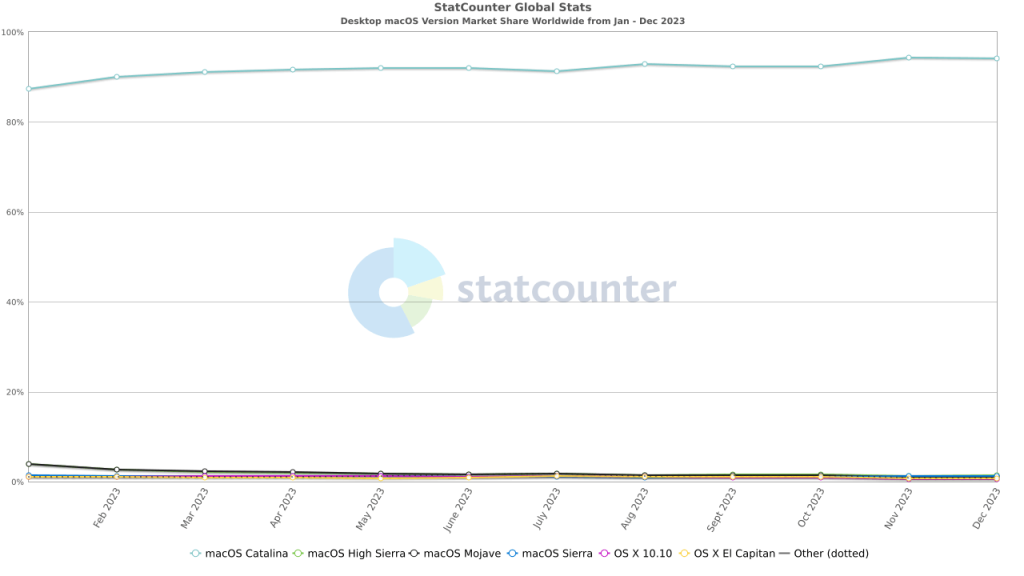
In 2023, the largest market share of MacOS operating systems, was MacOS Carolina with 91%, followed by High Sierra with 1.93, closely followed by Mojave with 1.87%. Last year, also the hegemony of participation was held by Carolina with 87%, High Sierra and Mojave each with 4%, which means that in the MacOS world, there is a greater tendency to MacOS Carolina in 2023.
Most used iOS operating systems in 2023
| Operating system | Percentage (%) |
|---|---|
| iOS 16.3 | 11,99 |
| iOS 16.6 | 15,26 |
| iOS 16.1 | 10,97 |
| iOS 16.5 | 10,79 |
| iOS 16.2 | 7,24 |
| iOS 16.4 | 5,76 |
| iOS 16.0 | 4,95 |
| iOS 15.7 | 5,02 |
| iOS 17.1 | 5,54 |
| iOS 15.6 | 4,64 |
| iOS 17.0 | 3,11 |
| iOS 12.5 | 1,77 |
| iOS 15.5 | 1,63 |
| iOS 16.7 | 1,57 |
| iOS 15.4 | 1,03 |
| iOS 14.8 | 0,97 |
| iOS 14.7 | 0,66 |
| iOS 14.4 | 0,6 |
| iOS 15.3 | 0,53 |
| iOS 14.6 | 0,51 |
| iOS 15.1 | 0,43 |
| iOS 10.3 | 0,44 |
| iOS 17.2 | 0,45 |
| iOS 15.2 | 0,36 |
| iOS 15.8 | 0,41 |
| iOS 15.0 | 0,31 |
| iOS 9.3 | 0,3 |
| iOS 14.2 | 0,26 |
| iOS 13.3 | 0,23 |
| iOS 13.6 | 0,19 |
| iOS 14.3 | 0,18 |
| iOS 13.2 | 0,15 |
| iOS 12.4 | 0,15 |
| iOS 13.7 | 0,12 |
| iOS 14.0 | 0,12 |
| iOS 11.0 | 0,12 |
| iOS 13.5 | 0,11 |
| iOS 14.5 | 0,11 |
| iOS 14.1 | 0,1 |
| iOS 11.3 | 0,09 |
| iOS 12.1 | 0,08 |
| iOS 12.3 | 0,07 |
| iOS 13.1 | 0,07 |
| iOS 13.4 | 0,06 |
| iOS 7.0 | 0,06 |
| iOS 11.4 | 0,05 |
| iOS 12.2 | 0,05 |
| iOS 9.1 | 0,04 |
| iOS 11.2 | 0,04 |
| iOS 12.0 | 0,03 |
| iOS 6.0 | 0,03 |
| iOS 7.1 | 0,02 |
| iOS 8.4 | 0,03 |
| iOS 9.2 | 0,02 |
| iOS 10.2 | 0,02 |
| iOS 8.1 | 0,02 |
| iOS 4.3 | 0,02 |
| iOS 17.3 | 0,02 |
| iOS 5.0 | 0,02 |
| iOS 9.0 | 0,01 |
| iOS 11.1 | 0,02 |
| iOS 5.1 | 0,01 |
| Other | 0,07 |
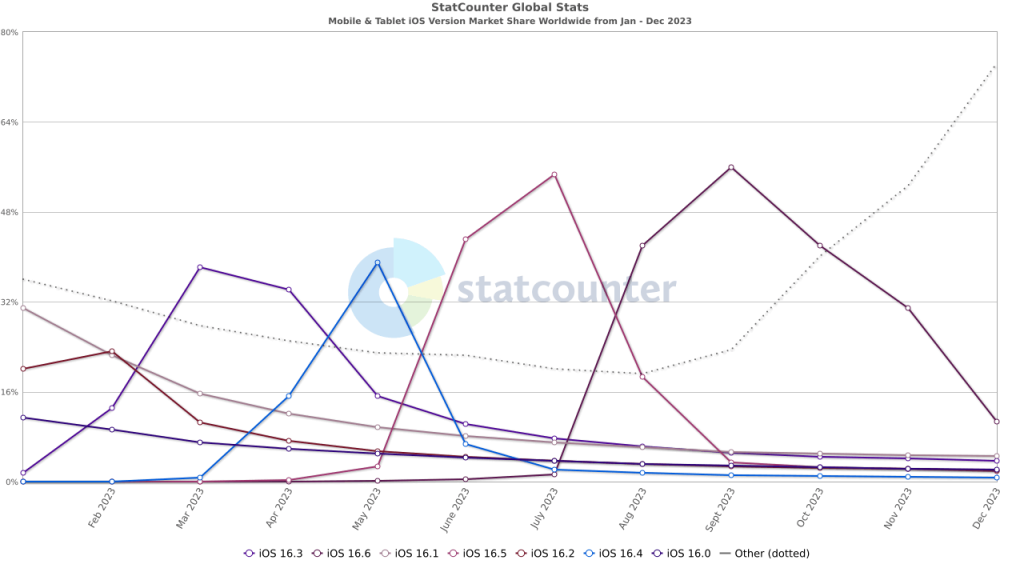
In 2023, the largest share in the iOS world was held by version 16.3 with 11%, followed by version 16.6 with 15%, while version 16.1 had a share of 11%. In 2022, the most used version was 16.1 with 31%, although in 2023, all 16.x versions add up to 64% in total, relative to previous versions.
Most used Android operating systems in 2023
| Operating system | Percentage (%) |
|---|---|
| 13.0 | 25,53 |
| 12.0 | 19,53 |
| 11.0 | 19,11 |
| 10.0 | 16,23 |
| 9.0 Pie | 7,21 |
| 8.1 Oreo | 3,35 |
| 8.0 Oreo | 2,42 |
| 7.0 Nougat | 1,85 |
| 6.0 Marshmallow | 1,58 |
| 5.1 Lollipop | 1,01 |
| 7.1 Nougat | 0,75 |
| 14.0 | 0,52 |
| 4.4 KitKat | 0,31 |
| 5.0 Lollipop | 0,3 |
| 4.3 Jelly Bean | 0,05 |
| 4.2 Jelly Bean | 0,03 |
| 4.0 Ice Cream Sandwich | 0,02 |
| 23.1 | 0,02 |
| 4.1 Jelly Bean | 0,02 |
| 23.3 | 0,02 |
| 23.7 | 0,02 |
| 2.2 Froyo | 0,01 |
| 23.9 | 0,02 |
| Other | 0,09 |
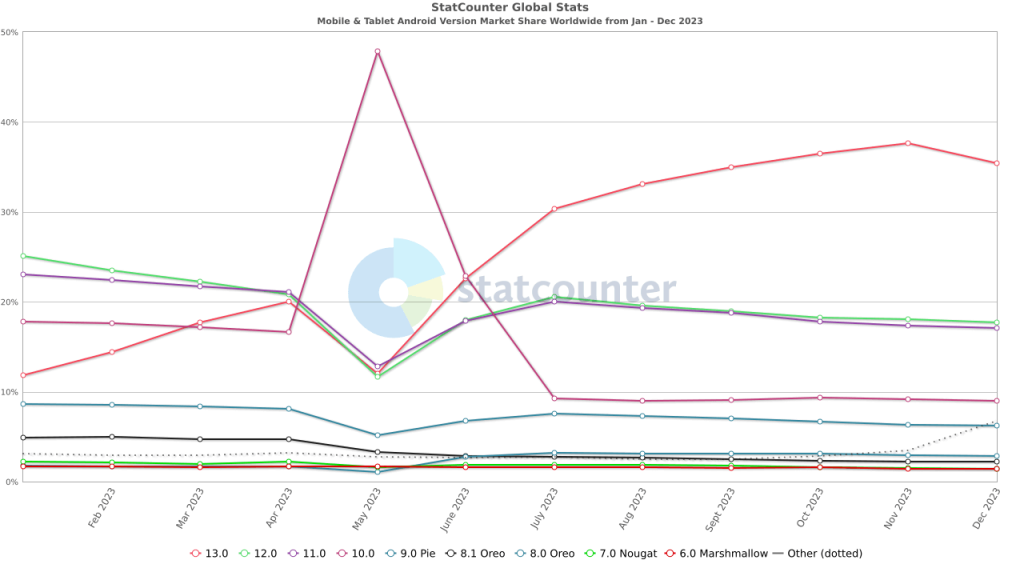
In the year 2023, the most used Android version was 13.0 with 25%, then followed by 12.0 and 11.0 with 19%, closing 10.0 with 16%. In the previous year, the highest share was 12.0 with 25%, then 11.0 with 23%, followed by 10.0 with 17% and finally 13.0 with 11.8%; this shows that in 2023, there was a greater adoption of version 13.0, decreasing the use of versions 12.0 and 11.0.
