

Xpress IoT Cloud Platform is a centralized IoT component management and monitoring system, supported on open source software, designed under a redundant and modular architecture, based on a big data framework, created to support multiple IoT gateway and sensor manufacturers.
Xpress IoT is a high performance service for the monitoring and maintenance of a wide variety of parameters, constituting a tool that can grow as the measured elements increase, always maintaining its reliability and performance.
No matter the type of sensors required for a solution, Xpress IoT adapts to any kind of sensors and protocols, facilitating the implementation of a centralized tool to receive distributed information from sensors, and the actions to be taken when their normal operation thresholds are exceeded.
We invite you to continue reading the following pages where the main features of the Xpress IoT platform are described:
Xpress IoT features
A) Functional dimensions of Xpress IoT
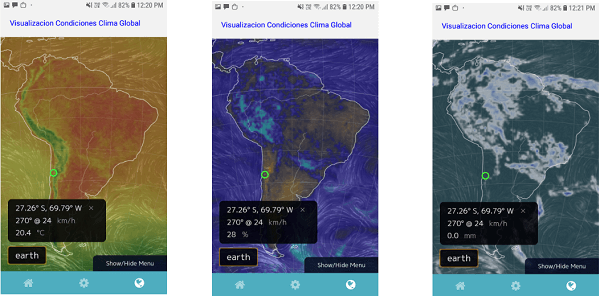
- The events received can be enriched with additional information such as geolocation.
- Real-time values of different parameters are obtained through geographically distributed sensors.
- Automatic remote actions or manual actions can be programmed from the IoT GW dashboard in particular by means of dry contacts, for example to switch to a backup power plant in case of a problem detected in the main power plant.
- Correlation of sensed variables makes it possible to recognize how one parameter is affecting another and to what extent it is doing so.
- The information presented can be printed in pdf format for reporting purposes of a particular situation.

B) Modular architecture based on big data framworks
Xpress IoT is a platform designed under a modular architecture for big data:
- It is based on big data components that allow high scalability of the system.
- It allows the creation of intuitive and versatile dashboards with advanced searches.
- Thresholds and their respective email notifications can be configured.
- Dashboards can be viewed from the web or mobile devices.
- IoT GWs are independently monitored to ensure proper operation of the platform.
- Communications are encrypted between remote sites and the central node to ensure system privacy and security.
- Communication with the IoT devices is bidirectional, because it not only receives measurements from the remote sensors, but can also act on them to take actions to mitigate the effects of abnormal values of a measured parameter.

Xpress IoT main components
The system bases its operation on the deployment of different types of dashboards to show from the general to the particular, the different components and measurements captured by the different IoT components.
The dashboards are highly configurable and can be adapted according to the operational and business needs of each client.
These dashboards are divided into three types:
- Main Dashboard,
- IoT GW Dashboard in particular and
- Sensor Dashboard in particular.
1) Main Dashboard
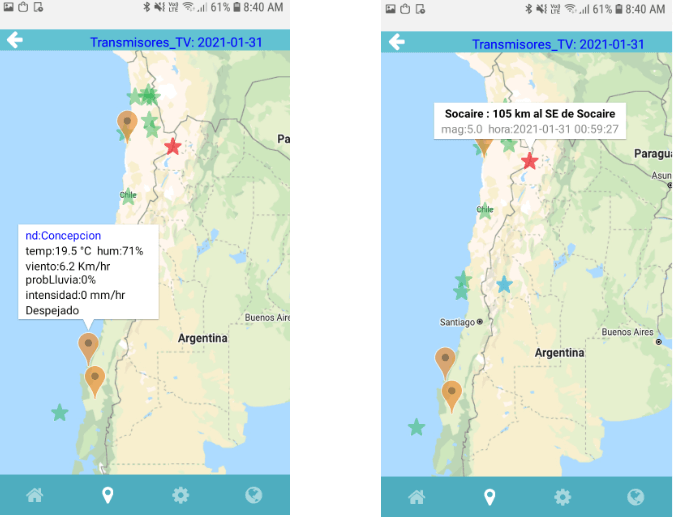
The purpose of the main dashboard is to show an overview of the status of your IoT installations. It consists of a map and a data table.

Xpress IoT Main Dashboard
The map shows the locations of all IoT GWs. When hovering over a location, the name of the IoT GW, the total number of sensors with their active alarms are displayed. Red indicates a sensor with alarms and green indicates a sensor without alarms.
The data table shows a summary of the sensor status of each IoT GW. The table shows the name of the IoT GW, the current and normalized alarm count for each sensor type, the total number of sensors with alarms, the count of communication errors between the sensors and the IoT GW, and the total number of installed sensors. When the name of an IoT GW is selected, the dashboard of the chosen IoT GW is displayed as shown below.
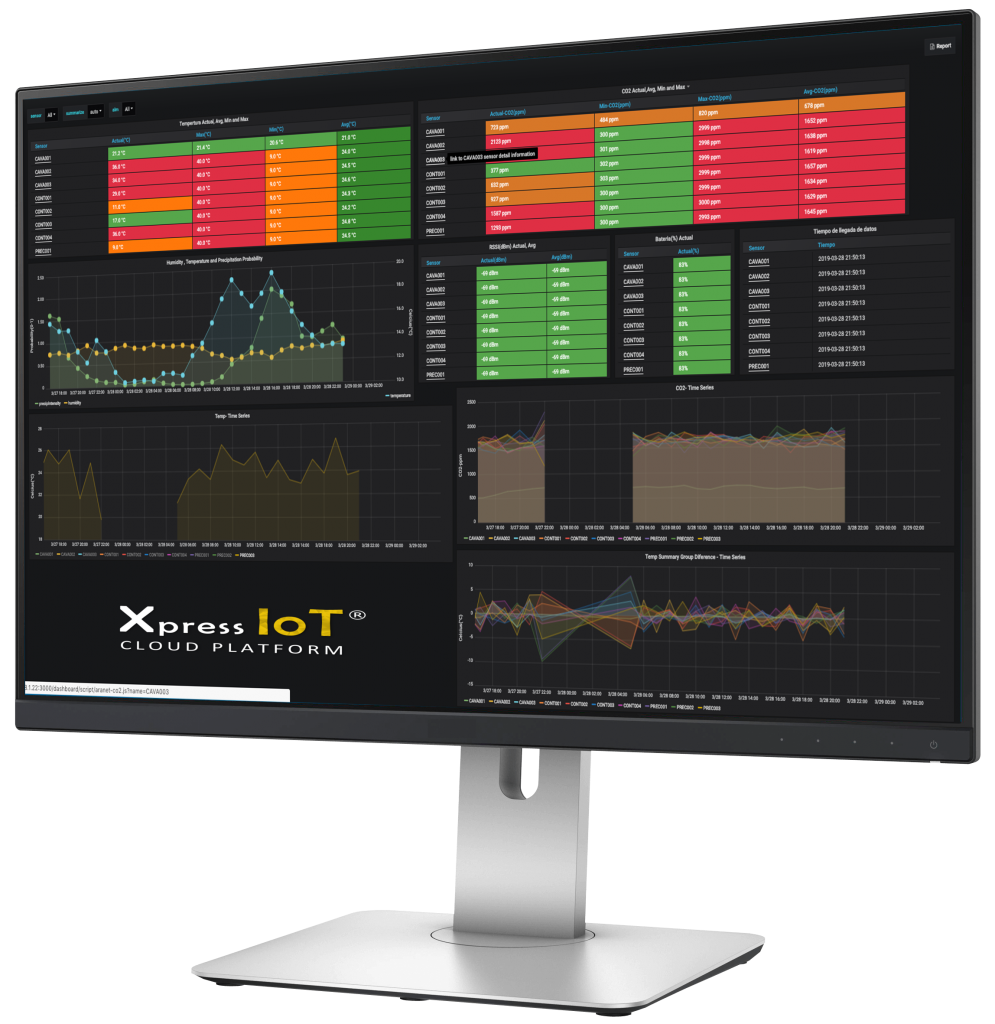
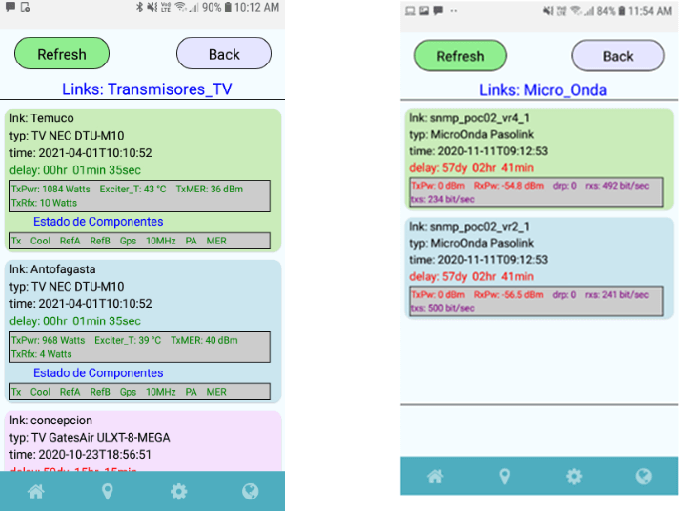
2) Dashboard IoT GW in particular
This dashboard displays relevant information of all sensors connected to a particular IoT GW. Mainly the data is displayed in two types of tables. The first table shows the current measurement values together with the arrival and delay times of the measurements, which facilitates the discovery of communication problems between the IoT GW and the sensors (especially for wireless sensors).
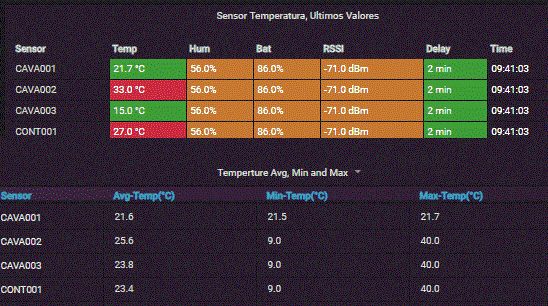
The background color can be programmed to change according to the configured thresholds.
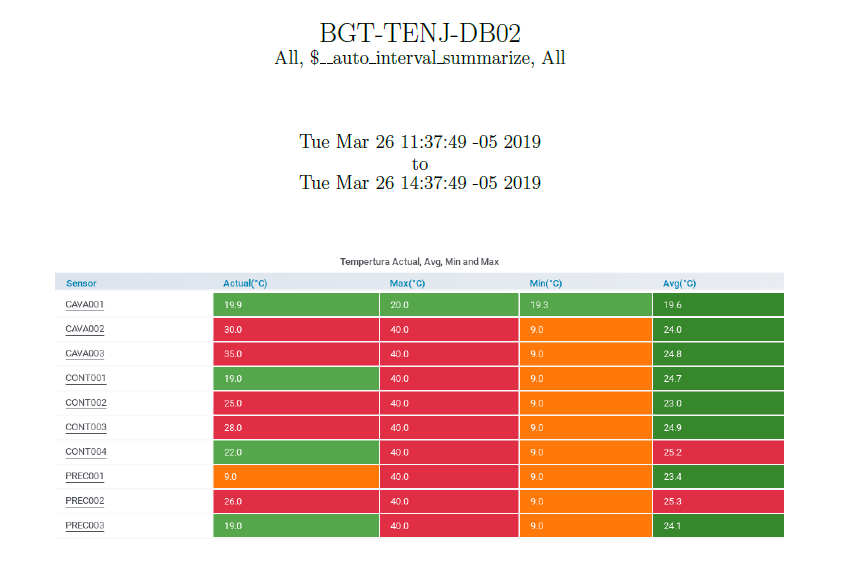
And on the other hand, the second type of table shows the average, maximum and minimum values of the measurements of each sensor in the chosen time frame.
When a sensor is selected, the Dashboard of the particular sensor is displayed.
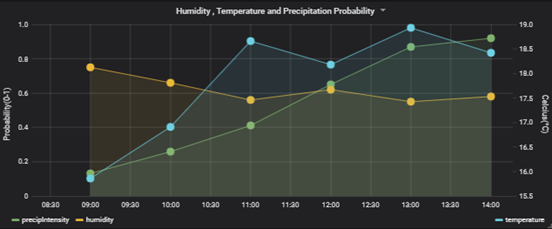
In this Dashboard you can also see the local temperature, relative humidity and probability of rainfall where the IoT GW is installed.
In this type of dashboard it is also possible to graphically observe the sensors tied to the IoT GW, showing the values currently measured, together with the colors indicating alerts in each one of them:
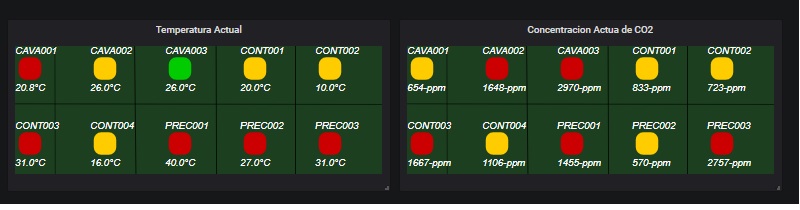
Xpress IoT is a highly flexible system, so graphs, tables and other elements can be built according to the customer’s particular needs.
In real life, the measured variables can affect each other, that is why Xpress IoT has a correlation function of the sensed parameters, to determine if the variation of one of them, affects to a greater or lesser extent to another, being possible that this is the root cause of an anomaly.
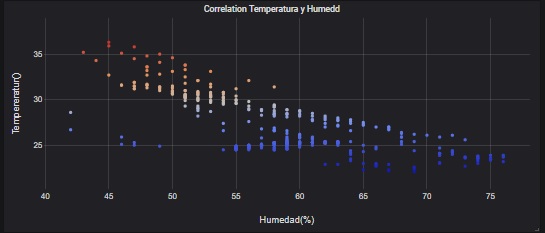
In the example shown in the graph, it is highlighted that there is a slight trend of lower temperature when humidity increases.
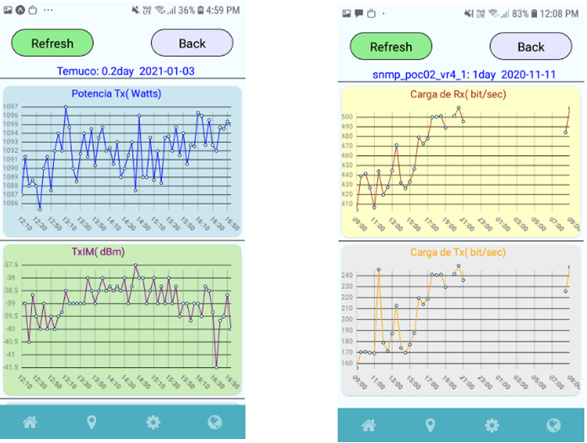
3) IoT Sensor Dashboard in particular
This Dashboard shows the relevant information of a particular sensor. It shows a time graph of the measurements of each parameter (e.g. temperature), a gauge of the current values, maps and photos and any information that is important to the customer.

All the information shown in the dashboards can be printed in pdf format, both current and historical values:
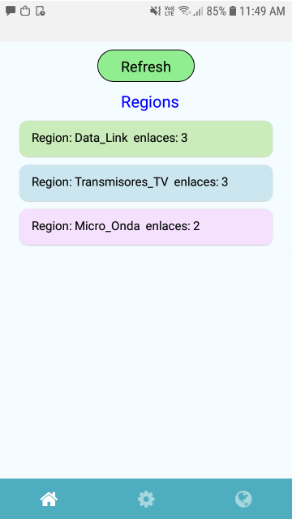
4) uNMS (micro–Network Management System) mobile App
Xpress Cloud IoT has a native mobile application, called uNMS, where the different zones or locations of the devices can be observed, with their respective graphs or tables of measurements, including geolocation, and remote commands.
Next we will show an example of a particular use case, where telecommunication components are monitored at the same time by SNMP protocol, and IoT sensors of the stations where these equipments are installed.
Xpress IoT application example
[Use case] Intelligent monitoring of microwave links, combining IoT and SNMP
- The SNMP protocol is also integrated into the platform, combining with IoT results in a solution with the best features of both technologies.
- IoT GWs can be installed at sites to capture data that is not available via SNMP, and then send remote trigger commands to mitigate the effects of changes in environmental variables.
- Xpress IoT is a tool to enable preventive maintenance, proactive analysis and process optimization.
- Field maintenance teams can take proactive actions to detect and fix problems at their root causes before they escalate to more critical situations.

Xpress IoT Professional Services
These are the services provided for the engineering, design, installation, maintenance and support of the Xpress IoT platform:
- Pre-sales engineering with visit to customer sites to determine the physical and connectivity conditions for the installation of IoT GW and sensors.
- Solution design including the necessary infrastructure for the number of IoT components to be supported.
- Installation of the solution, both of the servers that support Xpress IoT, as well as the IoT equipment (IoT GW and sensors).
- After the installation and stabilization phase of the system, training, support and maintenance services for the solution are provided.
Contact us for more information here in ITSoftware